Analysis
Contents
- Visualization tools
- Properties of the reaction network
- Kinetics simulations at different temperatures
- Removing unwanted TS structures
- Modifying the reaction network
Visualization tools
The Python library developed by Diego Garay at the Institute of Chemical Research of Catalonia, is a useful package to parse, process and transform the reaction networks created by AutoMeKin. All the data contained in
FINALDIR can be easily accessed using these tools.
The commandline script amk_gen_view.py allows to generate visualizations directly taking arguments from STDIN:
amk_gen_view.py FINALDIR RXNFILE
where RXNFILE is the name of the RXNet files explained above (RXNet, RXNet.cg or RXNet.rel). Additional arguments that may be passed are detailed here.
The following example shows how to create interactive plots from RXNet.cg file including all paths found at low level for Formic Acid:
amk_gen_view.py FINAL_LL_FA RXNet.cg --b --paths
While this one creates the corresponding plots for the paths that connect MIN1 with the H2+CO2 products:
amk_gen_view.py FINAL_LL_FA RXNet.cg --paths MIN1 H2+CO2
More details can be found in the user guide
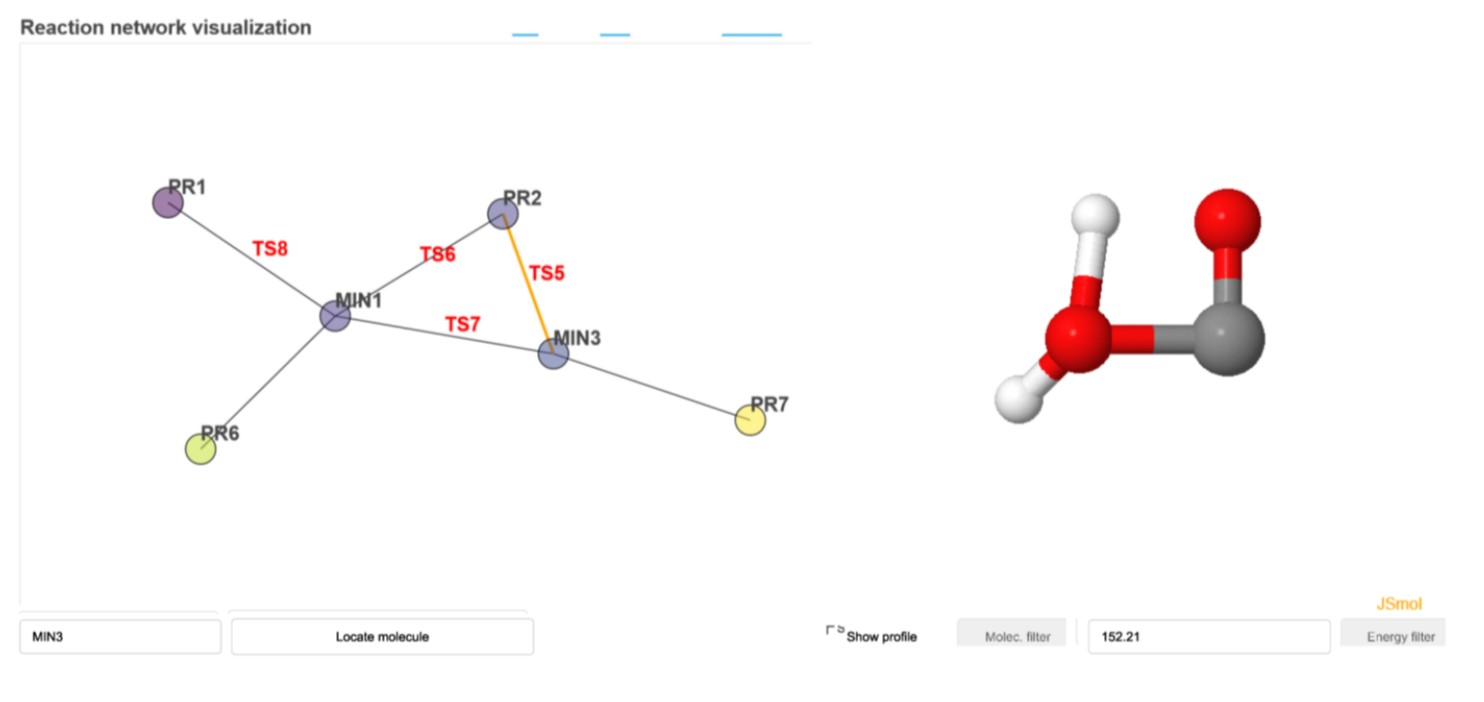
Example of an interactive dashboard for FA, with the reaction network on the left and a selected edge, i.e., TS, on the right. Clicking on “Show profile” enables visualization of the energy profile as well.
Properties of the reaction network
Another commandline script from the same Python library can be used to obtain the properties of the reaction network:
amk_rxn_stats.py FINALDIR -r RXNFILE
With FINALDIR and RXNFILE having the same meaning as for amk_gen_view.py.
Properties like the average shortest path length, the average clustering coefficient or the transitivity will be printed in a file called rxn_stats.txt.
Kinetics simulations at different temperatures
The kinetics calculations can be rerun for a temperature/energy different from that specified in the input file after the keywords Temperature or Energy. You may also want to use the allstates option as seen below. This can be easily done using the kinetics.sh command line script:
kinetics.sh value calc (allstates)
where value is the new value of the temperature in K or energy in kcal/mol, depending on your initial choice in the Kinetics section, and calc is either ll, for low-level, or hl, for high-level. Finally, with no other options, the conformational isomers will form a single state, which is the default for all sampling except vdW. However, using allstates as the last argument, the calculations will regard every conformational isomer as a different state, which is the default for vdW. Each calculation will create a new folder named FINAL_XL_molecule_Fvalue, with X = H,L and F=T,E.
Removing unwanted TS structures
As explained above, the use of very tight criteria in the screening process might lead to redundant TS structures in the FINAL directories. In those cases, the user can remove those structures as shown in the following example:
remove_ts.sh 2 4 7
where 2 , 4 and 7 are the labels of the TSs to be removed for the LL calculations. The corresponding script for the HL calculations is REMOVE_TS.sh. These two scripts will create a new FINAL_XL_FA $\scriptstyle{(}$X = H,L$\scriptstyle{)}$ directory where the selected TS structures have been removed.
Modifying the reaction network
Although unlikely, the algorithm for identifying conformational isomers may fail. The conformer families are stored in the MINinfo and TSinfo files within the FINALDIR folder. If one or more conformers are mistakenly assigned, the user can follow these steps to modify them:
- Modify the families of conformational isomers in the files
tsdirXL_molecule/working/conf_isomer.outand/ortsdirXL_molecule/working/conf_isomer_ts.outas needed $\scriptstyle{(}$X = H,L$\scriptstyle{)}$. - Then, run the script
tweak_rxnet.shfor low-level orTWEAK_RXNET.shfor high-level adjustments, respectively.
This will create a new FINALDIR with the manually modified reaction network structure.